


- What are on-chain metrics in cryptocurrency and why is it important to learn them
- How to analyze on-chain metrics
- Tools for analyzing on-chain metrics
On-chain analysis has become a crucial tool for cryptocurrency traders aiming to better understand market dynamics.
By analyzing data directly from the blockchain, traders can uncover insights into market trends, investor behavior, and asset flows.
Mastering on-chain data can transform how traders navigate the volatile crypto market, offering a powerful edge in decision-making.
As we explore the intricacies of on-chain analysis, we’ll reveal how it can significantly enhance your trading performance. In this article we will understand the different aspects of on-chain metrics, what they mean and how to use it for your investing strategy.
What Are On-chain Metrics?
On-chain metrics are data points derived from a blockchain’s public ledger, offering a transparent view of network activity and participant behavior.
These metrics include information such as transaction volumes, wallet addresses, token flows, network fees, active addresses, and more. Unlike traditional market indicators like price or volume charts, on-chain metrics provide a direct look at the underlying activity driving a cryptocurrency’s ecosystem.
Why Are On-chain Metrics Important?
On-chain metrics are data points extracted directly from a blockchain’s public ledger. They are crucial for cryptocurrency investors, traders, and analysts because they offer a transparent, verifiable, and unfiltered view of what is happening on a network.
Following is a detailed breakdown of why on-chain metrics are crucial and what they bring to the table.
Transparency and Reliability
Unlike traditional financial markets, which rely on a mix of public and private data, blockchains are fundamentally transparent. Every transaction is recorded on a public, immutable ledger. This means that on-chain data is grounded in verifiable facts, not speculation or unaudited reports.
Deeper Insight into Market Dynamics
On-chain metrics go beyond simple price and volume charts (technical analysis) and market sentiment (news and social media). They provide a deeper layer of information that can reveal underlying trends and behaviors. For example, a rising price with low transaction volume might be a weak, unsustainable move, while a rising price with high volume and increasing active addresses suggests legitimate demand and strong network adoption.
Understanding Investor Behavior
On-chain metrics allow you to track the actions of different types of market participants. You can see what large holders (“whales”) are doing, whether they are accumulating or selling. You can also monitor the flow of funds to and from exchanges.
- High inflows to exchanges: This can signal that holders are preparing to sell, which could create downward pressure on the price.
- High outflows from exchanges: This is often seen as a bullish sign, as it suggests that holders are moving their assets off exchanges for long-term storage or to use in DeFi protocols, indicating a desire to hold rather than sell.
Gauging Network Health
On-chain metrics are excellent indicators of a blockchain network’s fundamental health and growth. One can check for total active addresses, overall transaction volume and validator count. A higher number indicates that the crypto asset is in demand.
How To Analyze On-chain Metrics?
To select the appropriate metrics for analyzing a crypto asset, one must first define the purpose of the analysis. Common objectives include understanding the market sentiment, evaluating network health amongst other things. So to understand market sentiment you can look at active addresses, transaction volume, DeFi activity and holder activity.
Once your purpose is clear, choose the on-chain metrics that best serve your analysis. Below are some key metrics and their applications:
Once your purpose is clear, choose the on-chain metrics that best serve your analysis. Below are some key metrics and their applications:
Transaction Volume
Purpose: Measures the total value of assets transferred on the blockchain, indicating network activity and demand.
Analysis: High transaction volume often signals strong user engagement or adoption, while a sudden drop may indicate waning interest. Compare volume trends with price movements to assess market dynamics.
Active Addresses:
Purpose: Tracks the number of unique addresses interacting with the network, reflecting user adoption and engagement.
Analysis: Rising active addresses may indicate growing interest or adoption, while a decline could signal reduced activity. Cross-reference with transaction volume for deeper insights.
Exchange Net Flows:
Purpose: Monitors the movement of assets to and from exchanges, where inflows may suggest selling pressure and outflows indicate accumulation.
Analysis: Large inflows to exchanges often precede price drops, while outflows to wallets suggest long-term holding or investor confidence.
Network Fees:
Purpose: Indicates network congestion or demand for block space.
Analysis: Rising fees may signal high demand (bullish) but could also deter smaller transactions, affecting adoption. Compare with transaction volume to assess network efficiency.
Whale Activity:
Purpose: Tracks large transactions by major holders, which can influence price volatility.
Analysis: Large transfers to exchanges may indicate potential sell-offs, while moves to cold storage suggest accumulation. Tools like Glassnode’s whale alerts can help monitor these movements.
NVT Ratio (Network Value to Transaction Ratio):
Purpose: Compares a cryptocurrency’s market cap to its transaction volume, acting as a “price-to-earnings” ratio for crypto.
Analysis: A high NVT ratio may suggest overvaluation, while a low ratio could indicate undervaluation. Historical trends can provide context for interpretation.
MVRV Ratio (Market Value to Realized Value):
Purpose: Measures whether holders are in profit or loss by comparing market cap to realized cap (the value of coins at their last transaction price).
Analysis: A high MVRV ratio suggests holders are in profit (potential selling pressure), while a low ratio indicates losses (potential buying opportunity).
Hash Rate (for Proof-of-Work Chains):
Purpose: Reflects the computational power securing the network, indicating miner confidence and network security.
Analysis: A rising hash rate suggests strong miner commitment, often a bullish signal, while a drop may indicate declining confidence.
Now that you know the different on-chain metrics lets understand the tools you can use to analyze the above metrics.
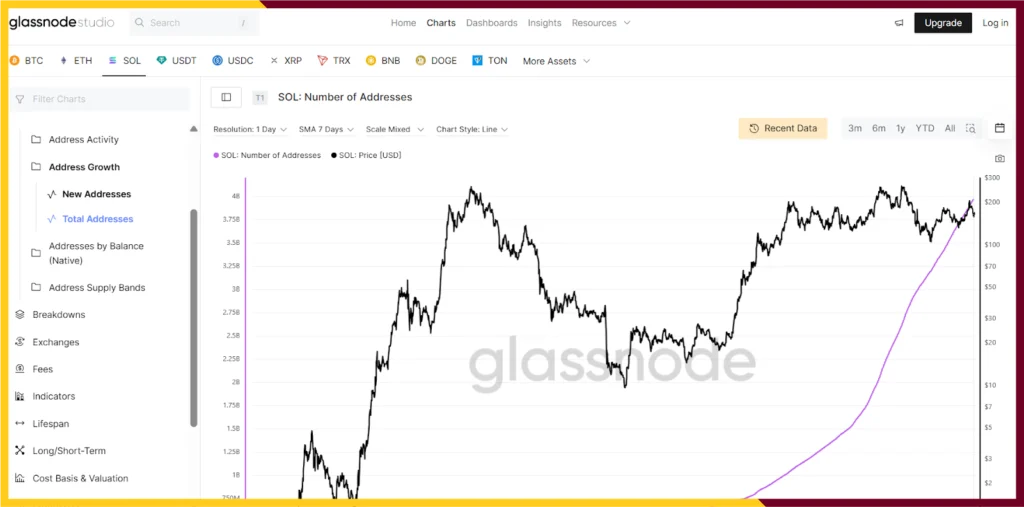
Glassnode: The All-in-One Platform for In-Depth Analysis
Glassnode is a leading on-chain data and intelligence platform. It is known for its extensive library of metrics and a powerful, customizable dashboard.
- Key Metrics to Focus On:
- Network Value to Transaction (NVT) Ratio: This is similar to a P/E ratio for a stock. A high NVT ratio can suggest the network is overvalued, as its value is growing faster than its usage (transactions). A low NVT ratio might suggest it’s undervalued.
- Exchange Flows: Track the volume of crypto moving into and out of exchanges.
- Inflows: High inflows can indicate increased selling pressure, as traders are moving coins from their personal wallets to exchanges to sell.
- Outflows: High outflows can suggest a bullish sentiment, as traders are moving coins off exchanges to “hodl” or store them in cold storage.
- Whale Activity: Monitor the behavior of large holders (“whales”). Sudden changes in their holdings or transaction patterns can be a precursor to major market moves.
- How to Use Glassnode:
- Explore the Metrics Catalog: Begin by familiarizing yourself with Glassnode’s vast library of metrics. They are well-documented with clear explanations of what each one signifies.
Create Custom Dashboards: Organize the charts and metrics most relevant to your analysis into personalized dashboards. This allows you to quickly monitor the data that matters most to your strategy.
- Set Real-time Alerts: Configure alerts to get notified when key metrics hit a certain threshold (e.g., when exchange inflows spike).
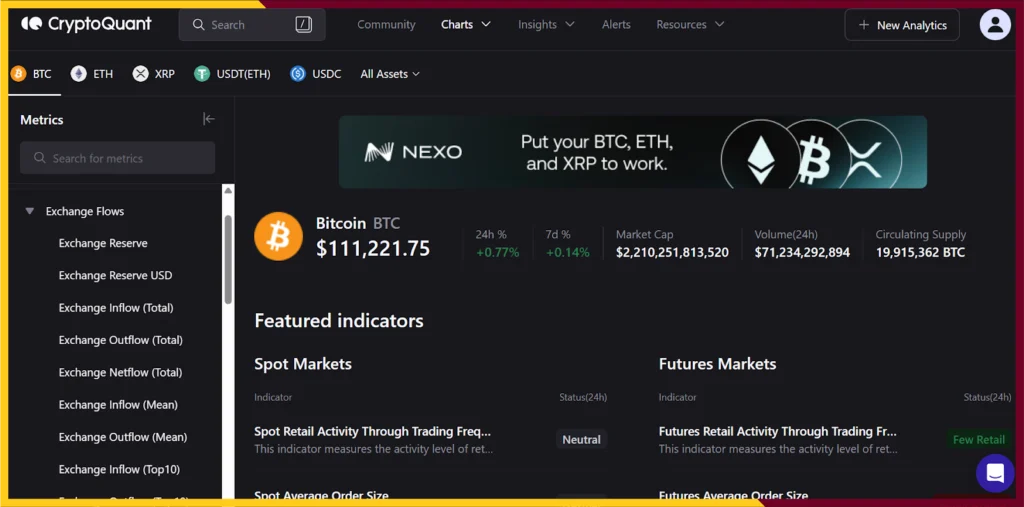
CryptoQuant: Tracking Capital Flows and Major Players
CryptoQuant is a platform that specializes in tracking capital flows and the behavior of key market participants, particularly exchanges and miners. Its strength lies in its user-friendly visualizations.
- Key Metrics to Focus On:
- All Exchanges Inflow/Outflow: This is a straightforward metric to gauge market sentiment. A large spike in inflows can signal an increase in selling pressure.
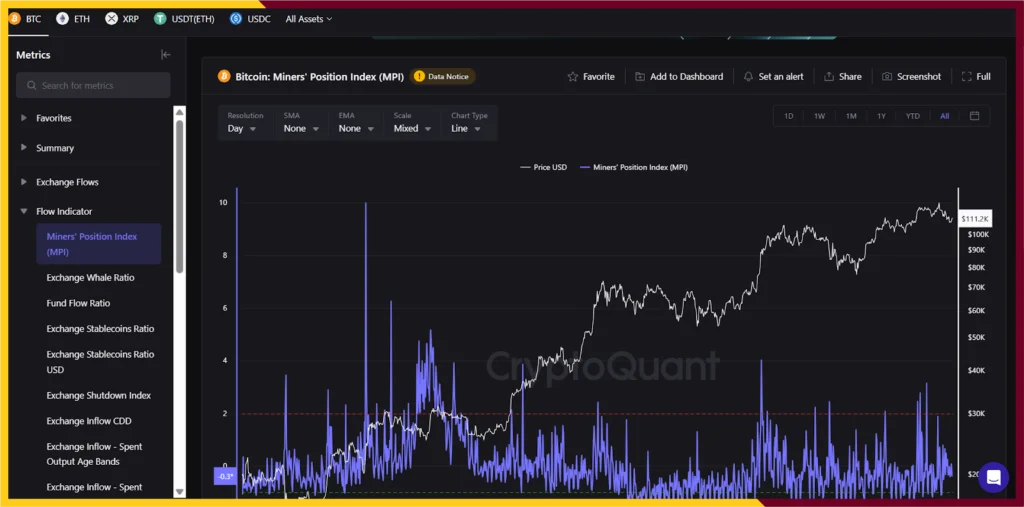
Miner’s Position Index (MPI): The MPI tracks the movements of Bitcoin from miners’ wallets. A high MPI value can suggest that miners are selling their Bitcoin, which could increase selling pressure.
- Whale Tracking: CryptoQuant provides specific data on whale wallet activity, allowing you to see their deposits and withdrawals from exchanges.
- How to Use CryptoQuant:
- Navigate the “Indicators” Section: The platform organizes its data into various indicators. Look for the “Exchange Flows,” “Miner Flows,” and “Whale” sections to start.
- Interpret Visualizations: CryptoQuant’s charts are designed for clarity. Pay attention to sudden spikes or dips in data, as these often correspond to significant market events.
- Analyze Miner Behavior: Miners are a constant source of selling pressure. By monitoring their flows, you can get a better sense of whether they are accumulating or distributing their holdings.
Dune Analytics: The Power of Custom Queries for DeFi
Dune Analytics is a powerful tool for advanced users who want to dive deep into a specific protocol or create a custom dashboard. It is particularly popular for analyzing DeFi and other Ethereum-based projects.
- Key Concepts to Understand:
- Dashboards: Leverage the vast library of dashboards. Most of them are interactive. You can use filters and parameters (e.g., a dropdown menu to select a specific token or a date range) to customize the data without changing the underlying code.
- How to Use Dune Analytics:
- Start with “Discover”: If you’re new, don’t try to write a query from scratch. Instead, use the “Discover” page to find pre-built, community-contributed dashboards. Search for a specific project (e.g., Aave, MakerDAO) or a metric you’re interested in (e.g., “NFT volume”).
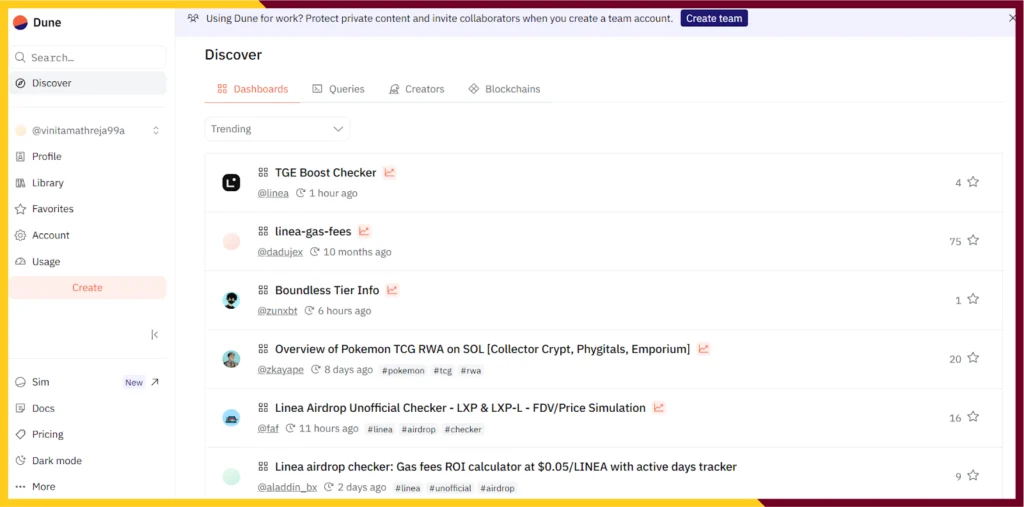
- Explore Dashboards: Spend time examining how the data is visualized. The dashboards often provide comprehensive overviews of a protocol’s health, user base, and tokenomics.
Blockchain Explorers: The Manual Approach
Blockchain explorers are the foundational tools for anyone interested in on-chain data. They are free, public, and offer the raw, unfiltered data straight from the blockchain.
- Key Uses:
- Transaction and Wallet Exploration: Etherscan (for Ethereum), BscScan (for Binance Smart Chain), and others allow you to manually search for a specific transaction hash or wallet address.
- Verify Balances: You can check the balance of any wallet and see its history of inflows and outflows.
- Investigate Smart Contracts: You can read the code of a smart contract, see its transaction history, and even interact with it.
- How to Use a Blockchain Explorer:
- Go to the Explorer Website: Go to the appropriate explorer for the blockchain you want to investigate (e.g., etherscan).
- Paste an Address or Transaction Hash: Use the search bar to look up a wallet address, transaction ID, or smart contract address.
- Drill Down: From a wallet page, you can click on individual transactions to see details like gas fees, timestamps, and the addresses involved.
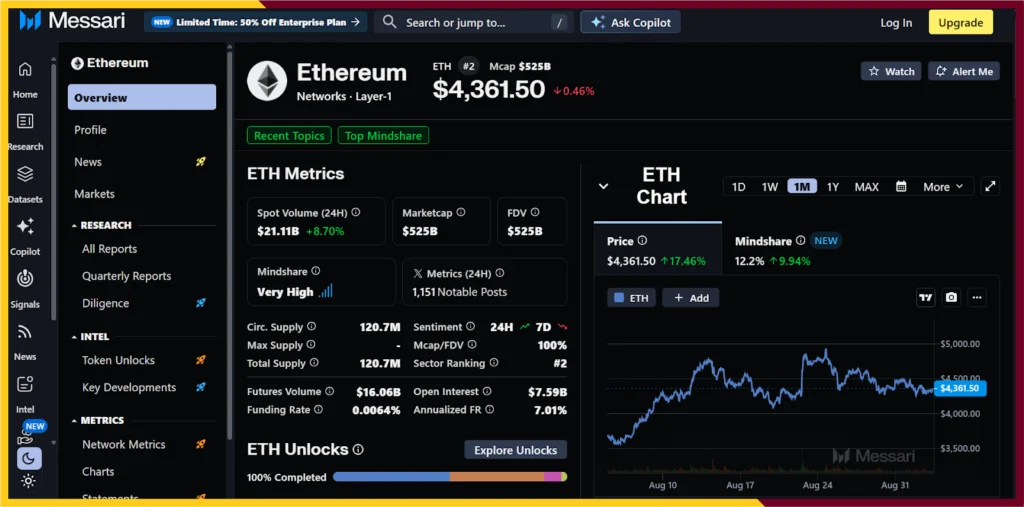
Messari: Combining On-Chain and Fundamental Analysis
Messari is a data and research platform that provides a holistic view of the crypto market. It combines on-chain data with fundamental analysis, project tokenomics, and regulatory insights.
- Key Features:
- Asset Profiles: Messari has a detailed database for hundreds of crypto assets. Each profile includes key on-chain metrics, but also a summary of the project, its team, and its tokenomics. This is invaluable for due diligence.
- Screener and Filters: Use Messari’s screener to filter tokens based on a variety of criteria, including market cap, on-chain activity, and key metrics.
- Research Reports: Their research team produces in-depth reports on market trends, new protocols, and regulatory developments, giving you the necessary context to interpret the raw data.
- How to Use Messari:
- Start with the “Screener”: Use the screener to find assets that match your criteria. For example, you can look for assets with a low NVT ratio and a high number of active addresses.
- Read the Research Reports: Messari’s reports are well-respected in the industry. They provide a narrative and fundamental context that raw data often lacks.
- Explore Asset Profiles: Before investing in a project, use its Messari profile to get a comprehensive overview of its tokenomics and on-chain health.
Wrapping Up
To sum up, on-chain analysis plays a vital role in helping investors make informed decisions. It helps them weigh the overall sentiment of the market or an asset in particular. Tools like Glassnode, CryptoQuant, Dune Analytics, blockchain explorers, and Messari empower users to analyze key metrics such as transaction volume, active addresses, exchange flows, and whale activity, among others.